Manage Lists
- Available with
- Free
- Tailored
- Team
Managing Lists
In iTop, lists are quite common. They can be found in menu items which point to lists, or the search results, as well as the global search. Once a list of objects is displayed, the operations that can be performed on the list are always the same.
For example, below is a list of Contacts:
If a list contains more than a (configurable) number of elements, it is displayed as a paginated list:
Starting with iTop 2.2.0, the Export actions are only available to the end-users which profile(s) include the BULK_READ privilege. For backwards compatibility with iTop 2.1.0, all standard profiles include this privilege, but this may not be the case if the profiles have been customized in your installation of iTop.
Toolkit menu
When a list of objects is displayed in iTop, a certain number of operations can be performed on the list itself (without modifying the objects in iTop). These operations are executed through the toolkit popup menu at the top-right of the list.
Configure This List
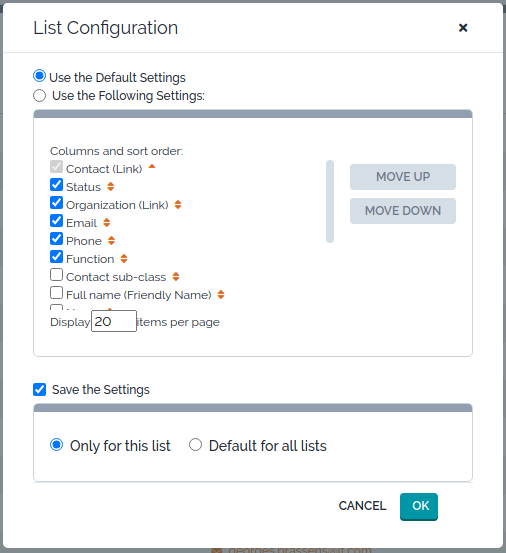
The first possible operation consists of configuring the appearance of the list. You can choose:
-
Which columns are displayed and in which order
-
How the list is sorted
-
How many items will be displayed at the same time (see paginated lists above)
-
Which list this configuration will apply to: (Only to this specific list, or to all lists which do not already have a specific configuration).
All this configuration is done via the popup dialog:
Advanced case: If your list displays multiple classes of objects (eg. SELECT a,b FROM Person AS a JOIN UserRequest AS b…), then you cannot save the configuration Only for this list, but when you save it for Default for all lists, it will only impact lists which do select exactly the same classes with the same alias, for eg if another list is based on that query (SELECT a2,b FROM Person AS a2 JOIN UserRequest AS b…), then the configuration saved on the first list will not apply.
eMail
This action is similar to the eMail action on the details of an object, except that the hyperlink inserted into the message points to the specified list of objects.
CSV Export
The CSV export action displays a configuration dialog which allows to:
-
Select the format options: separator character for the CSV (comma, semicolon, tab or any other character)
-
Specify a text qualifier character (to be placed around text strings inside the CSV)
-
Pick a character encoding
-
Choose, for enumerated fields (like statuses) whether the values must be localized (i.e. use the values as they appear on-screen) or use the internal (language independent) codes.
-
Pick the fields to be included in the export
-
Arrange the order of the columns
To arrange the order of the columns, drag and drop the columns in the table displayed in the Column order section at the bottom of the dialog. To drag a column click in the header of the column.
When your export is properly configured, click Export to build it. If the export contains a large amount of data, (more than 1000 lines) a progress bar is displayed.
When the export is complete, you can either click on the link Click here to download at the top of the dialog box to download the result as a .csv file, or copy and paste the export as plain text from the text area:
How to paste CSV data in Excel 2007/2010
If you use copy/paste to import CSV data into Excel, all the data is put in one column only. Fortunately, this is easy to change.
In the Data tab of Excel, click on the Text To Columns icon:
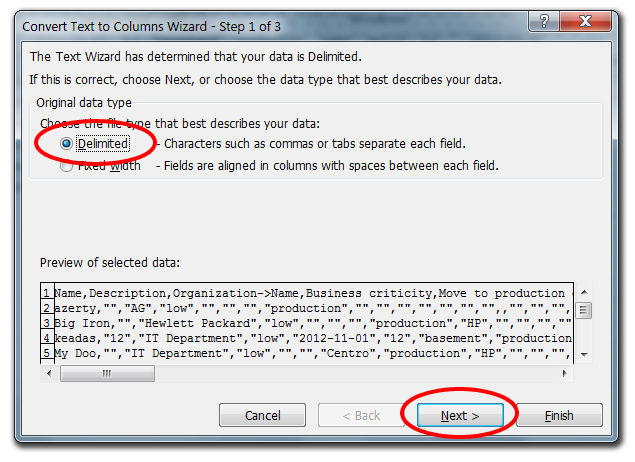
The following dialog wizard appears:
Select Delimited and click Next >.
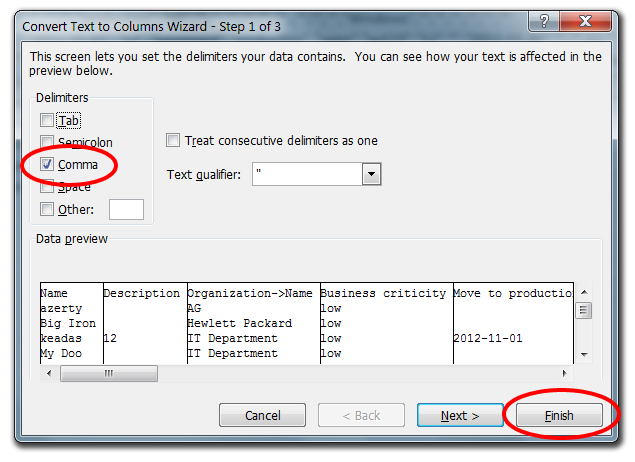
Select Comma and click Finish.
The next time you copy/paste CSV data in the same session (without closing and restarting Excel), Excel will automatically perform the text-to-columns conversion with the same settings.
Excel Export
A direct export to Excel (XLSX format) is available from the menu:
The following dialog box is displayed:
The Excel export action displays a configuration dialog which allows to:
-
Pick the columns to be included in the export
-
Arrange the order of the columns
To arrange the order of the columns, drag and drop the columns in the table displayed in the Column order section at the bottom of the dialog. To drag a column click in the header of the column.
When you click on Export, the Excel file is built. If the list of objects to export is large (>1000), a progress bar is displayed. Once the export is complete, you can download the Excel file by clicking on the link Click here to download at the top of the dialog box:
To export large amounts of data (e.g. several thousands of objects), the CSV export can be significantly faster than the Excel export.
PDF Export
Available in iTop 2.2.0 and later, a new menu item Export as PDF is available:
This menu generates a PDF document with one big table containing one row per object in the list and one column for each selected field.
The PDF export action displays a configuration dialog which allows to:
-
Select the page size for rendering the PDF: either A3, A4 or Letter
-
Select the orientation of the page: Portrait or Landscape
-
Pick the columns to be included in the export
-
Arrange the order of the columns
To arrange the order of the columns, drag and drop the columns in the table displayed in the Column order section at the bottom of the dialog. To drag a column click in the header of the column.
The PDF output is rendered with columns of equal widths (i.e. if there are 10 columns selected, each column will use 1/10th of the page width). It looks better when a relatively small (<10) number of columns is selected. Use the Landscape orientation if you need to generate a PDF with many columns.
When you click on Export, the PDF document is created. If the list of objects to be exported is large (>1000), a progress bar is displayed. Once the export is complete, you can download the PDF file by clicking on the link Click here to download at the top of the dialog box:
Add To Dashboard
Every result displayed as a list can be added to one of the editable dashboards. Click on the menu Add to Dashboard:
Then select the dashboard to which the list will be added and the type of “Dashlet” to use:
A list can be added to a dashboard either as:
-
A plain list of objects
-
A pie chart (By grouping the objects on a given field)
-
A bar chart (By grouping the objects on a given field)
-
A table with the count of objects, grouped on a given field
When the user presses Ok, the new dashlet is added at the end of the selected dashboard (by adding a new cell after the last used cell). If Edit the dashboard is checked, then the modified dashboard is immediately opened in the dashboard editor.
Refer to How to edit your dashboards ? for information about how to customize the resulting dashboard.
Create a Shortcut
When prompted, enter the name for your new shortcut (this is the name that will appear under My Shortcuts in the menu), and click Ok.
The new shortcut is then added to the menu.
The minimum value for the Refresh interval is 5 seconds.
You still have unanswered questions ? Ask us.
Give, get, ask…
Join our community of users to share your knowledge and good practices.


